Unless Biff Tannen has gifted you a copy of the latest Sports Almanac, you can’t predict the future. None of us can. We also cannot control random variance. What we CAN do is put forth an effort to improve our odds in small increments by using the tools available to us.
Home runs are one of the most exciting events in all of sports, because you never know when the next ball will leave the yard. Fortunately, we can use data to improve our odds of winning props and in DFS. The following indicators are helpful:
- Targeting pitchers that are prone to the long ball
- Vegas over/under and implied totals
- Exploiting lefty/right splits
- Utilizing ballpark factors and home/road splits
- Ride the “hot hand”- some players hit home runs in bunches
- Pay attention to news about launch angle adjustments
- Watch the weather – wind is a major factor in some ballparks but not others. Check out this article by Baseball America to learn more.
Each one of these factors can increase your chances, but never underestimate the power of random variance! There will be days when you place a bet on a hitter that “checks all of the boxes”, and they go 0-4 with two strikeouts. That’s the nature of the game.
Start with Vegas and pitchers
Vegas over/unders and implied totals per team will generally lead you to pitchers that get hit hard.
Last season, nine starting pitchers surrendered thirty or more home runs. The leaders in HR surrendered are always worth targeting, but you should also HR/9 innings per pitcher, and home runs surrendered by bullpen.
In 2023, seven bullpens surrendered eighty home runs or more:
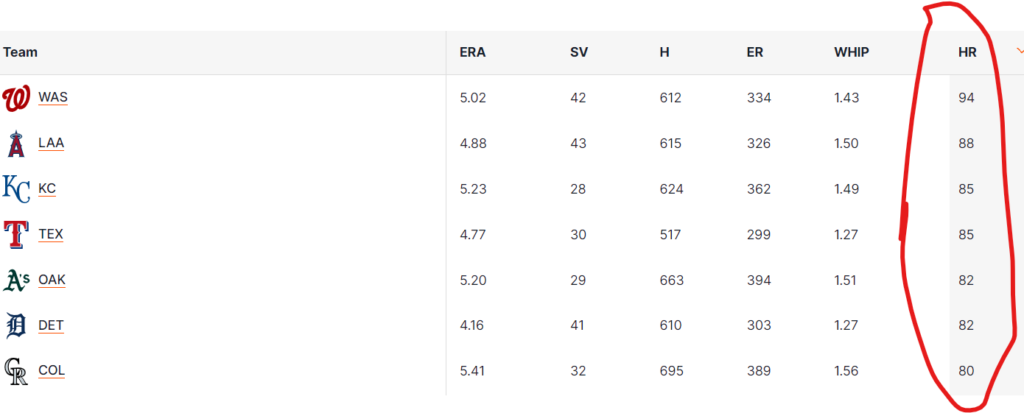
If you’re targeting an SP that doesn’t go deep into games or if the matchup is a bullpen game, this set of data will be useful. In terms of trends, bullpen stats will probably normalize around June. While you can refer to the previous season’s data to some degree, there is often a lot of turnover in bullpens, so take it with a grain of salt.
The power of splits
Some players have more extreme platoon splits than others. Let’s take Jack Suwinski for example; in 2023, 24 of his 26 home runs were against righties! In 115 at bats, he hit two home runs versus lefties. In short, Suwinski is virtually unplayable vs. LHPs.
While platoon splits (lefty/righty) are the most important in terms of matchup, there are others that while not required, might be useful:
- Home/road – if you’re already building park factors into your analysis, pass on this one. If not, it is worth checking out.
- Spot in batting order – back to the Suwinski example from earlier – he hit 12 of his 26 home runs while batting fifth in the lineup. There are a variety of explanations for this from matchups to protection from the third and fourth hitters.
- Performance by month over career – some batters are first half hitters and some heat up in the summer. Others are consistent all-season long.
- Pitch type splits – this info is available on Fangraphs, but I do not utilize it for HR props. If a hitter is particularly strong against a certain type of pitch, the opposing team will likely adjust their strategy as not to give them easy pitches to hit.
Park Factors
Statcast provides robust data on how much offense is generated in each ballpark. When looking at park factors, Statcast states that “each number is set so that “100” is average for that metric, and the park-specific number is generated by looking at each batter and pitcher, controlled by handedness, and comparing the frequency of that metric in the selected park compared to the performance of those players in other parks.”
In short, a rating of 100 means that an average amount of home runs have left the yard over the selected span:

It is not surprise that the most balls leave Great American Ballpark. The default setting for this data is “three-year rolling” so that there’s multiple seasons worth of data. You can take a deeper dive by handedness, year, and conditions.
Riding the hot hand
Some players hit home runs in bunches. For example, last season, Trea Turner hit 10 home runs in 11 games. Such performances are outliers, but smaller streaks are more common. For example, last season, Max Muncy hit three home runs in four games and four over a five-game stretch. Chasing hot streaks shouldn’t be your top priority, but pay attention when see you headlines about hot bats.
Conclusion
You can’t predict the future, but you can certainly improve your chances of winning MLB home run prop bets by focusing on the right data.